Linaro Forge MAP and Performance Reports
Linaro MAP can be used for profiling serial, multi-threaded (OpenMP), multi-process (MPI) and accelerated (Cuda, OpenACC) programs running on research and production systems, including the CSCS Alps system. MAP can be executed either with its graphical user interface or from the command-line. In the first case, the user can set the profiling configuration using the GUI and then see the results. In the latter (recommended) case, the user can use the MAP executable to launch the application they want to profile which will generate a report file that can then be opened from the locally installed client.
Note
Linaro MAP is provided in the linaro-forge uenv.
Before using MAP, please read the linaro-forge uenv documentation, which explains how to download and set up the latest version.
Linaro Forge MAP
We will focus here on the profiling using MAP from the CLI but the same configuration applies in the other case as well. To debug an MPI application on Alps the following script is necessary:
> map -n <num_of_procs> --mpi=slurm --mpiargs="<slurm_arguments>" \
  --profile <executable> <executable_arguments>
This will generate a profile report in a binary file with suffix .map.
To open this file we can open the Linaro Forge Client on our local machine, navigate to the Linaro MAP tab, connect to the corresponding Remote and then select LOAD PROFILE DATA FILE to locate the file.
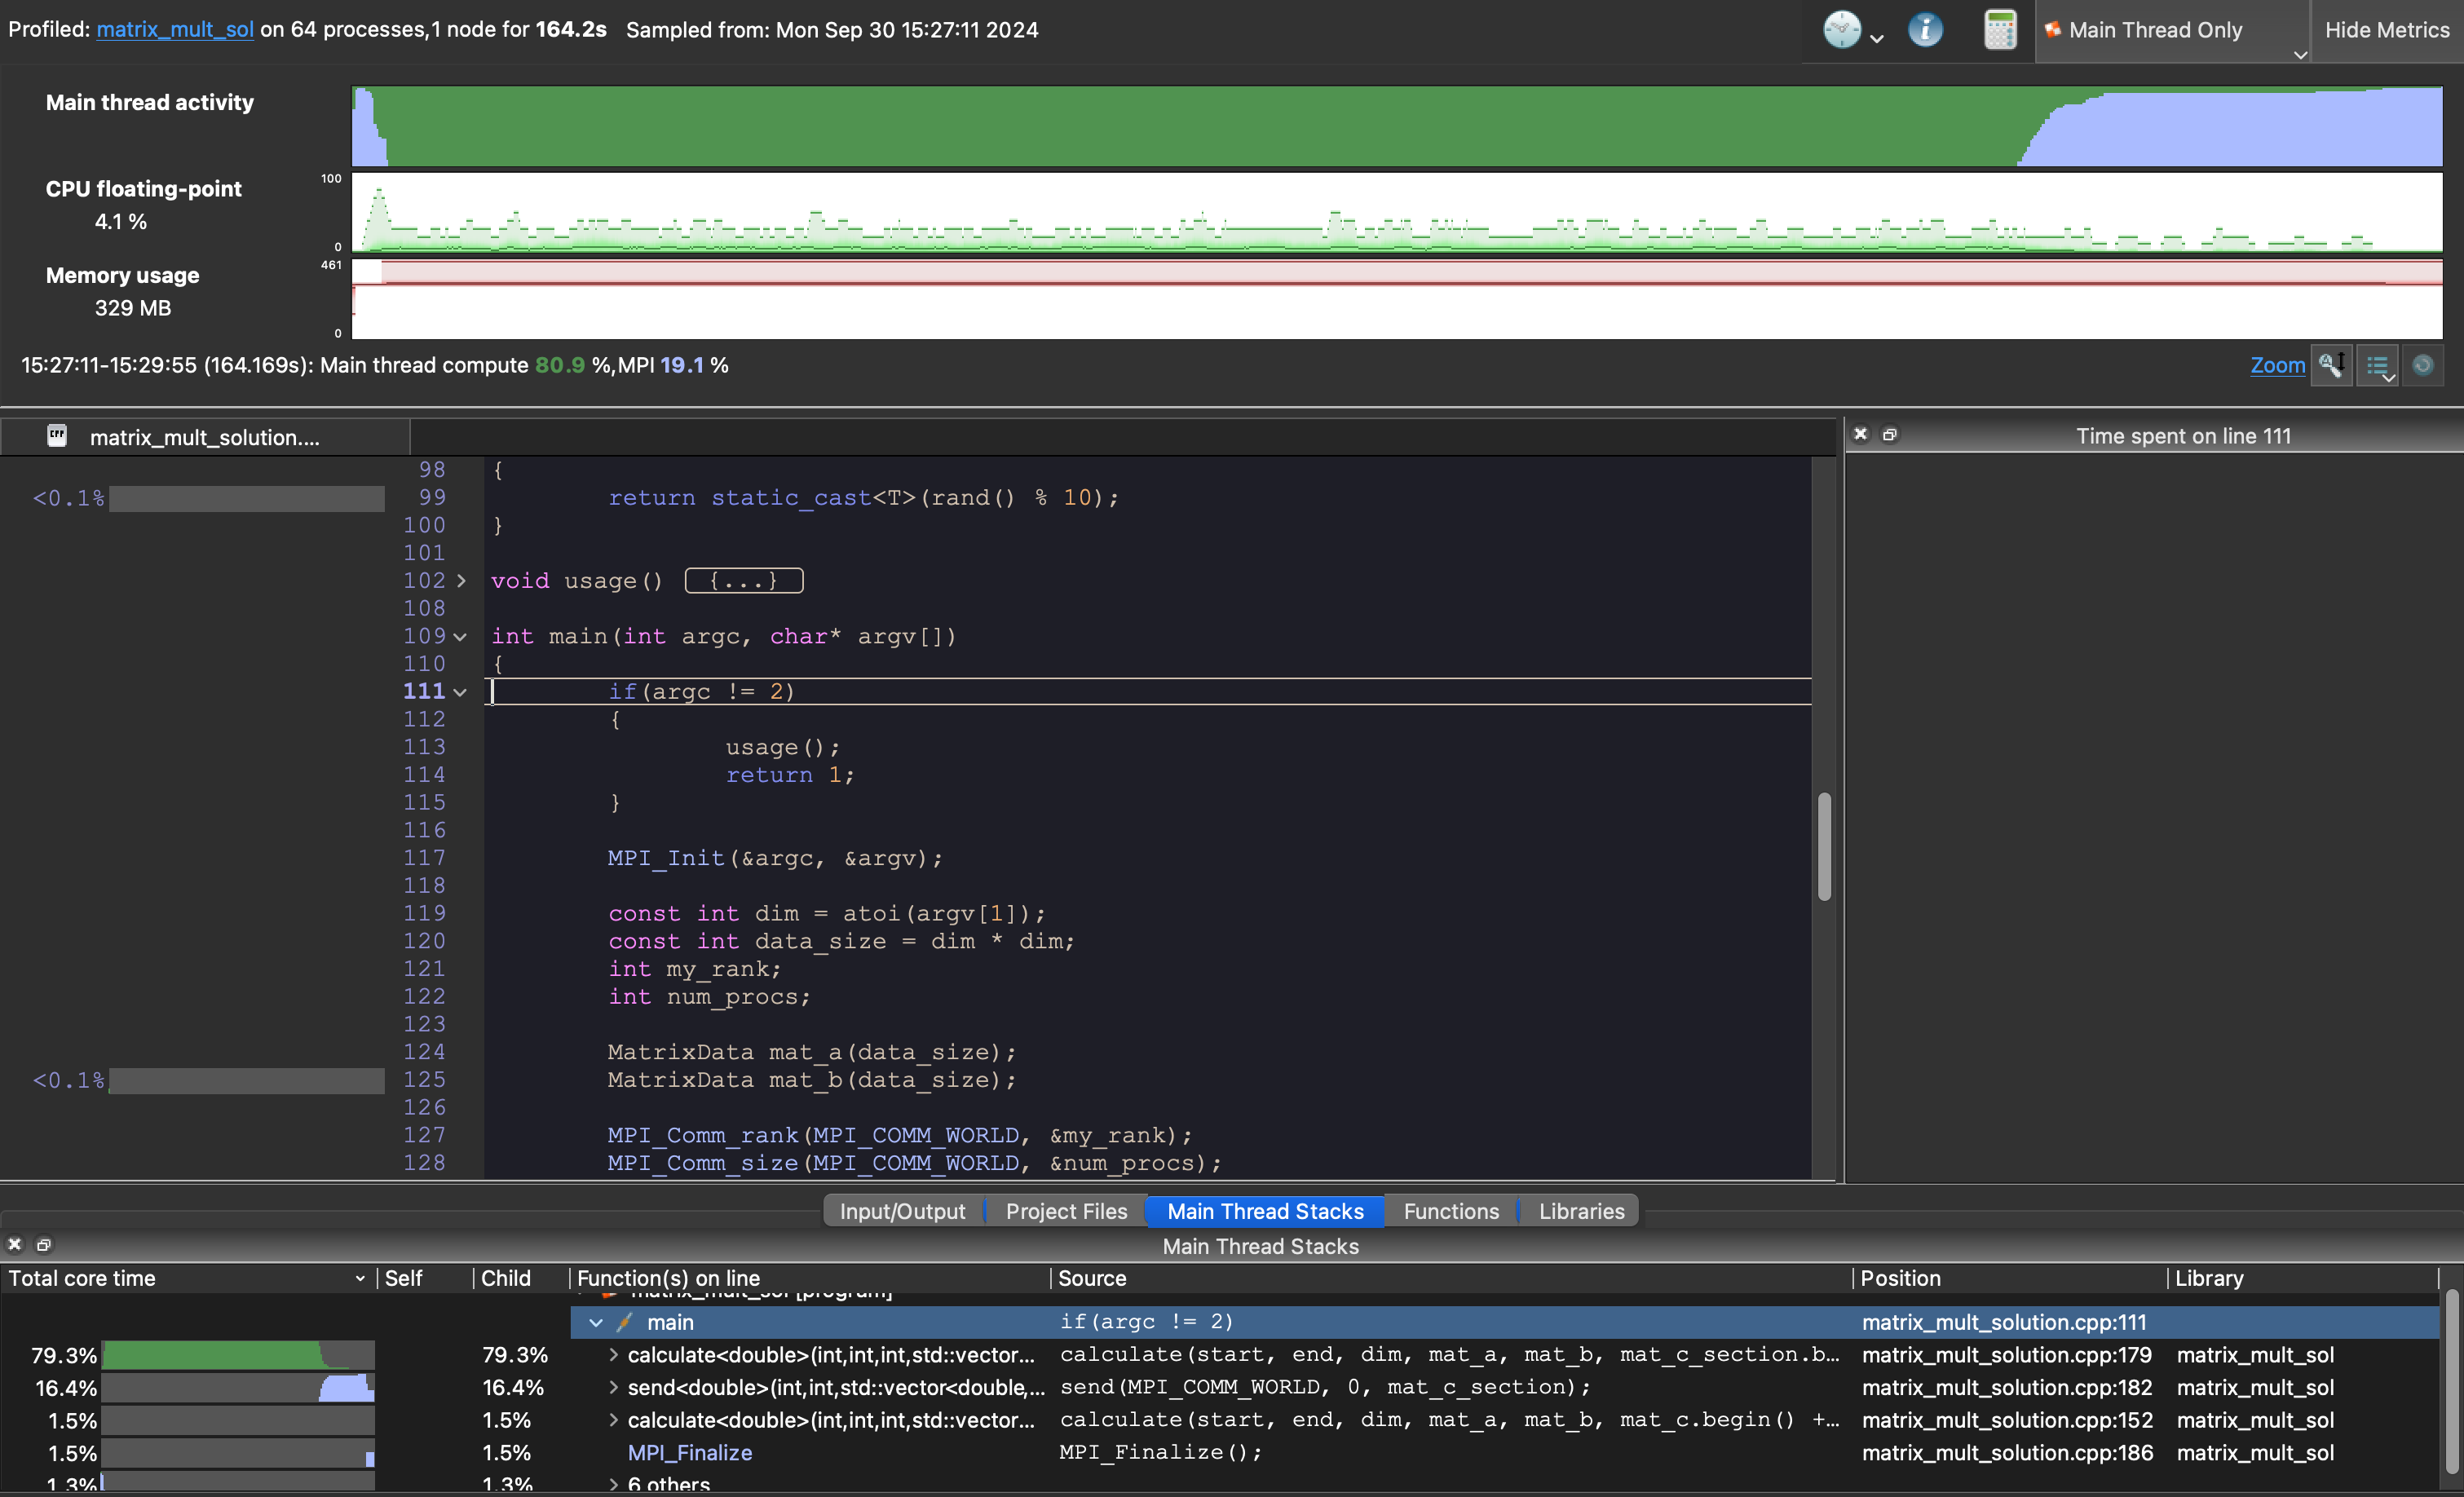
After loading the report file we will be in the home of Linaro MAP.
Linaro Forge Performance Reports
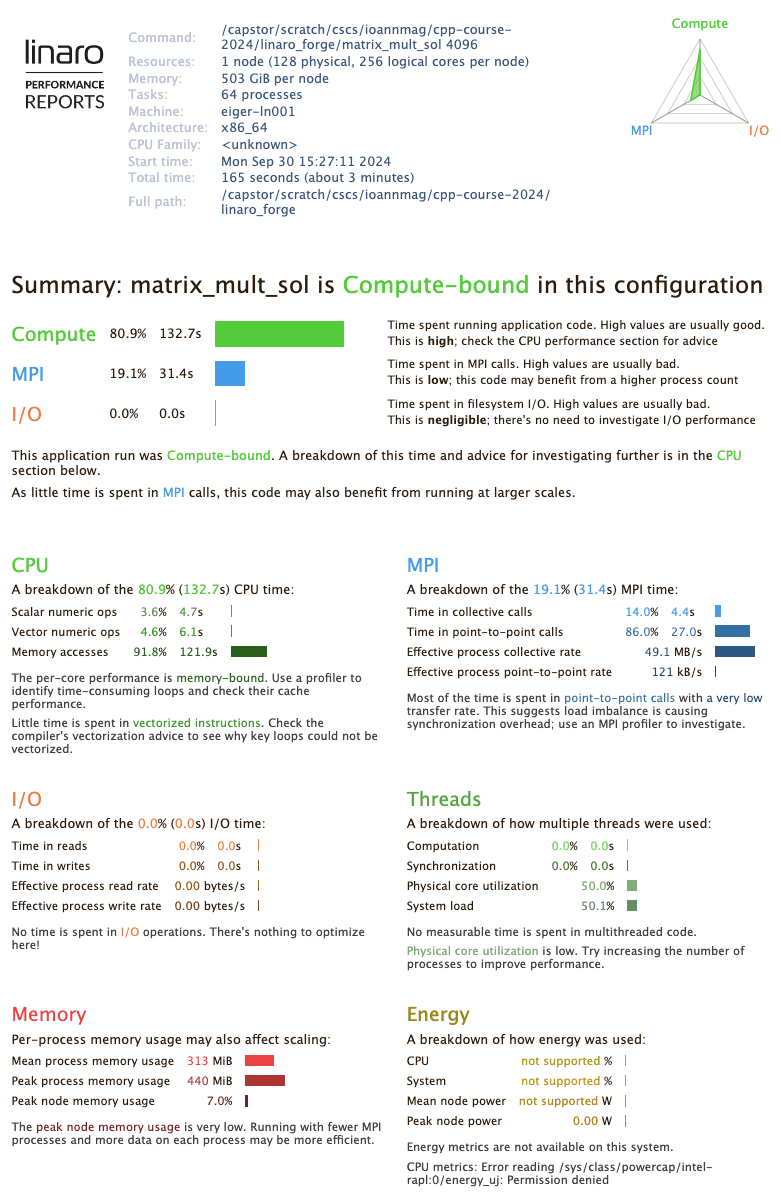
Linaro MAP also allows the generation of a high level Performance Report in HTML format that shows key metrics of the profiled application.
To see this we can click in the toolbar Reports > View HTML Performance Report in browser.
This will look like the following:
More informations regarding how to use Linaro MAP and Performance Reports are provided in the Forge User Guide.
Troubleshooting
See the troubleshooting guide for the linaro-forge uenv.